
Understanding the charts
Updated
Charts turn the votes of a session into a picture. The estimate itself never changes when you switch charts: every chart shows the same votes in a different shape, so you can choose the view that makes agreement, spread, and outliers easiest to read. The charts are pictures only. They cannot be clicked, dragged, or focused.
The result chart
Open a completed session and select Results. While open voting is running, Results updates as votes arrive. The chart counts how many participants voted each value. With the three votes 2 sp, 5 sp, and 8 sp, it shows three equal parts or bars.
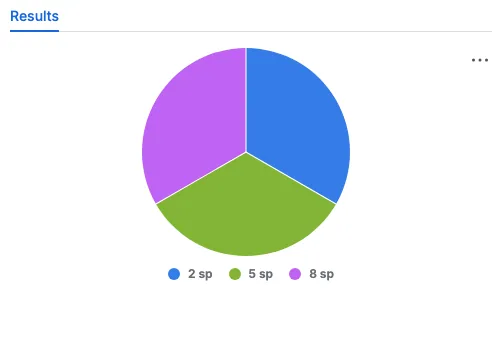
The pie legend sits below the chart and lists 2 sp, 5 sp, and 8 sp, one colour for each voted value. A larger slice means that more participants chose that value. Three equal slices mean the team split evenly.
Your chart type is personal and does not change anyone else's view. Open your Jira avatar menu, choose Scrumpy Poker, find Chart type, and select Pie, Vertical bar, or Horizontal bar. The choice follows you across spaces and applies to every result you open.
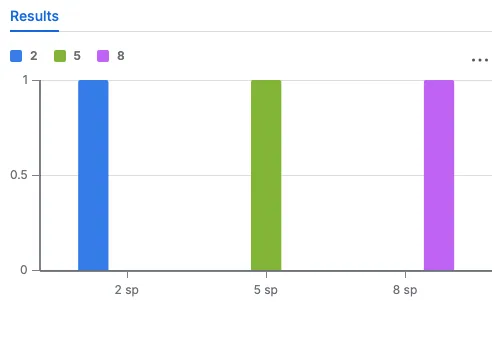
The vertical bar chart keeps the same three votes. Its legend sits above the chart, the card values are on the horizontal axis, and the bar height is the number of voters. It is easier to compare two values that are close together.
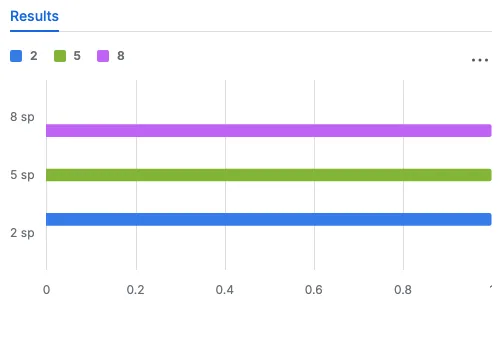
The horizontal bar chart turns the same bars on their side. The card values are on the left, the bar length is the number of voters, and long labels stay readable.
Use the pie for a quick share at a glance, the vertical bars to compare close values, and the horizontal bars when the labels are long.
Quadrant
A perspective with two parameters shows a Quadrant tab after Results once the session completes. Each axis is one parameter, drawn with its real values, including negative ones.
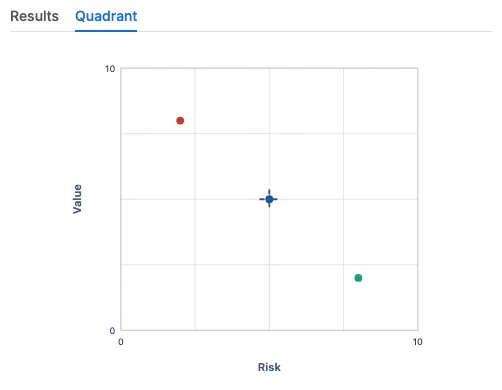
Each dot is one participant's vote at its pair of parameter values. The dashed crosshair marks the averaged position calculated from the recorded votes. The chart has no legend: the colours keep the dots apart, but they do not map a dot to a person. That is deliberate, because the chart shows how the votes compare, not who cast them.
Read a cluster of dots as agreement, a wide spread as a discussion that is still open, and a dot far from the crosshair as an outlier. The quadrant is useful when two factors decide the estimate, for example risk and value.
Radar
A perspective with three or more parameters shows a Radar tab after Results once the session completes. Each ray is one parameter, scaled from its minimum at the centre to its maximum on the outer ring.
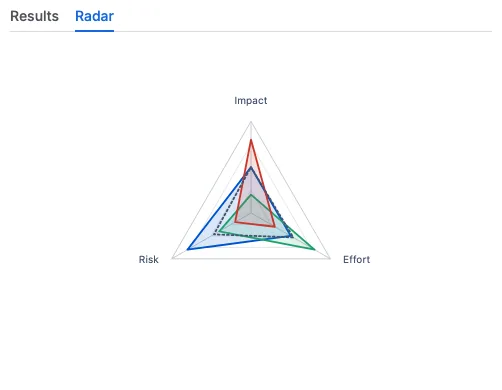
Each participant is one polygon. A corner pulled toward the outer ring means a high value on that parameter. The dotted polygon is the averaged position calculated from the recorded votes. The chart has no legend, so read the shapes rather than looking for names.
Overlapping polygons mean the team agrees on the profile. A polygon that pulls away on one ray shows where the disagreement sits. The radar is useful when several parameters describe the estimate at once.
Heat map
Open a planning session, switch the edit mode to Bulk voting, select a card perspective such as Scrum, open the Bucket tab, and select Results. The heat map compares every listed work item in one picture.
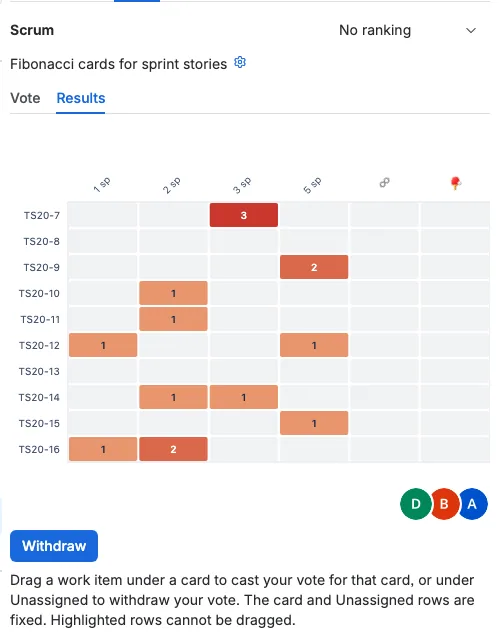
Rows are the work items and columns are the cards of the perspective. The number inside a cell is how many participants chose that card for that work item. The colour runs from light orange at one vote to dark red at the highest count, and a grey cell means nobody voted that card.
The heat map has no legend. The card labels and the numbers in the cells are the key:
- A dark cell with 3 means all three voters agree.
- Three separate 1 cells in a row mean the team split three ways.
- A grey row means the work item has no votes yet.
Use it to spot the work items that need another round of discussion and the ones that are already settled.
Scatter
Open the same Bucket tab for a free-scale perspective such as Time and select Results. The scatter chart compares the story points voted for every listed work item.
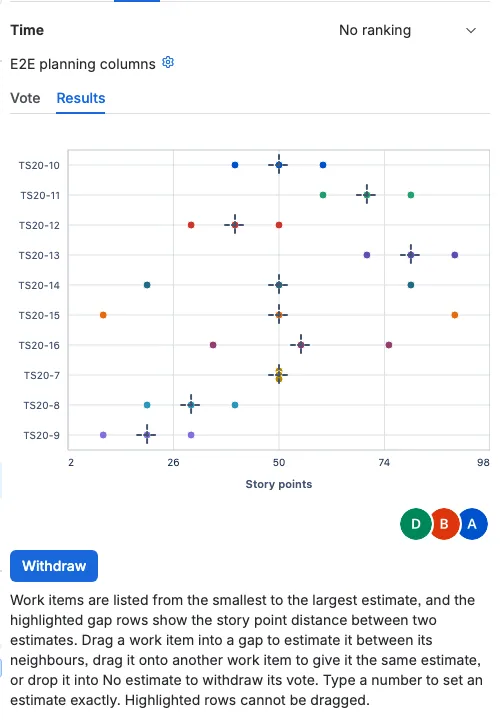
Rows are the work items, the horizontal axis is story points, and every dot is one vote. Dots of the same work item share a colour, and votes at the same value fan out vertically so none is hidden. The dashed cross marks the averaged story points for that work item, and it appears only when more than one vote exists.
The scatter chart has no legend. Read each row from left to right:
- Dots close together mean the team agrees on that work item.
- Dots spread far apart mean the estimates differ, and the work item needs discussion.
- The dashed cross is the average that becomes the estimate.
- A dot far from the cross is an outlier worth talking about.
The heat map answers what card the team chose. The scatter answers how far apart the numbers are. Together they show agreement across a whole planning session at a glance.